https://varun.ca/polar-coords/
Coordinate system
좌표시스템은 2D, 3D 공간 안에서 점들의 위치를 결정하는 수들을 사용하도록 한다.
Cartesian Coordinate system
가장 유명한 좌표 시스템은 데카르트 좌표 시스템이다. 숫자 x, y 점을 (x,y) 숫자 좌표 쌍으로 각 점을 위치하게 한다.
SVG, Canvas, WebGL 그리고 Sketch & Illustrator 에서 활용할 수 있다.
 {: width=”600”}
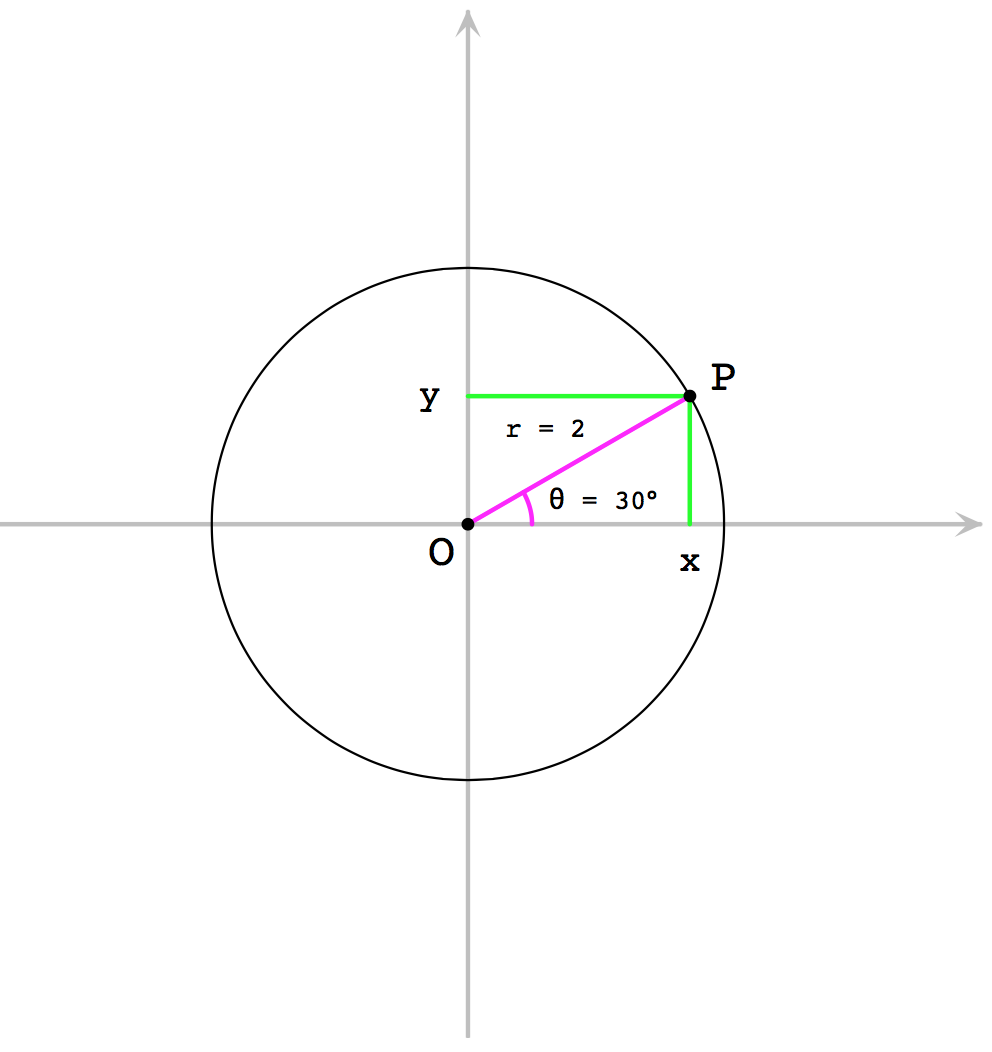
Polar Coordinate System
극좌표계는 2D 좌표 시스템으로 각 점이 r 과 \(\theta\\) 로 결정된다. r은 원점에서 원주까지 거리인 반지름이고 \(\theta\) 는
 {: width=”600”}
Converting between Polar and Cartesian Coordinates
삼각법을 사용한 아래 방정식으로 극좌표계 (r, \\(\theta\\) )에서 데카르트 좌표계로 변환할 수 있다.
1 | float x = r * Math.cos(theta); |
Patterns
아래 패턴은 모두 극좌표를 사용해 생성한 패턴이다.
데카르트 좌표는 사각 그리드 위에 배치하기 아주 좋은 선택이다. 만약 원 주변에 무언가를 배치하려면 극좌표이 우선 선택할 수 있다. 반지름 상수를 유지하기 때문에 각 점에 대한 각을 \(angle = 360^{\circ} * index / number of sides \) 같이 계산한다.

아래 자바스크립트는 위 아이디어를 구현하고 있다. 위 그림에서 점의 바깥 가장자리 원은 points(12, 200) 을 사용해 생성했다. 그 다음 점들은 points(12, 175, 15) 를 사용했다. CodePen splash 가 이것을 사용해 구성했다.
1 | function points(count, radius, offset = 0) { |
Polygon Generator
보통 다각형(폴리곤)은 등각인 다각형으로 모든 측면이 같은 길이에 같은 각이다. 이것은 표준 다각형의 모든 정점은 원 위에 균등하게 배치된 점인 것이다.

SVG 다각형을 생성하려면 points() 함수를 사용해 점의 목록을 생성한다. 그리고 점 사이를 연결한다. SVG에서
1 | /** |
예) http://winkervsbecks.github.io/gems
https://codepen.io/winkerVSbecks/pen/PmNJpJ
상대적 극좌표
기본을 점을 (r,$$\theta$$) 로 선언할 때 이것은 원점 (0,0)에 상대적이다. 결국 원점을 점 위치로 이동한 것 과 동일하므로 정점에 상대적으로 다루는 곡선의 위치로 선언해 사용한다.
1 | const x = cx + r * Math.cos(theta); |

SVG 캔버스에서 어떤 위치에 가운데 위치한 다각형을 그리기 위해서 다각형 생성기를 수정한다.
1 | function polygon(noOfSides, circumradius, rotation, [cx = 0, cy = 0]) { |
예) https://codepen.io/winkerVSbecks/pen/wrZQQm
회전
극좌표를 이용한 사례중 어떤 점을 중심으로 회전하는 것을 생각할 수 있다. 여기 (cx, cy) 점이 회전하는 곳이다.
일정한 간격, 시간, 위치에 따라 \(\theta\) 를 증가 혹은 감소 시키면 상대적 위치에서 점이 이동한다.
1 | x = cx + r * Math.cos(theta); |
예) https://codepen.io/Yakudoo/pen/aOEeXB
극좌표 곡선
여기까지 개별 점 (위치)를 살펴보았다. 몇몇 점을 그룹지어 집합에 그룹지으 형상을 선언한다. 다각형 생성 함수를 사용해서 형상의 각 정점의 위치를 계산한다. 유사한 함수를 수학 방정식을 사용해 작성해서 복합 형상과 곡선을 생성할 수 있도록 한다.
2차원 곡선은 방정식 y = f(x) 형으로 묘사된다. 예를 들어 원의 방정식은 \(x^2 + y^2 = r^2\) 이다. 이것은 x와 상대적인 y 를 반복해서 자취(locus) 로 불리는 점의 집합을 생성할 수 있다. 각 점은 (x, f(x)) or (g(y), y) 형태를 가진다.
극좌표는 극좌표 곡선을 그릴 수 있다. 원의 극좌표 방정식은 r = 2 * cos(0) 이다. 극좌표 곡선 위에 점은 (r(0), 0) 형태를 갖는다.
1 | // examples of fn: |
https://codepen.io/winkerVSbecks/pen/pdVLPo
Eukleides
All the diagrams in this post were created using a language called eukleides. It is a fantastic tool for making geometric drawings. Just look at this declarative API 😍
1 | c = circle(point(3, 0), 3) |